

A common query from users revolves around the precise measurement of latency in APISIX. When utilizing APISIX, how should one address unusually high latency?
In reality, discussions on latency measurement are centered around the performance and response time of API requests. Understanding these aspects is crucial for ensuring efficient API services, especially in B2B software where clients demand high API availability and performance. In sensitive scenarios like stock trading software within financial markets, latency can significantly impact traders.
Then, what is latency and what is latency in APISIX? Latency in APISIX refers to the time taken for the entire process of an API request, from being sent by the client to receiving the response. This delay comprises factors such as client network latency, APISIX internal processing time, and interaction latency with upstream services.
For a better understanding and measurement of these latencies, we can categorize them into several key components.
Client-to-APISIX Network Latency: This measures the time taken for a request to travel from the client to APISIX, influenced by factors such as the distance between the client and APISIX, network congestion, etc. Specialized tools can be employed to measure this time.
APISIX Internal Processing Time: This encompasses the time APISIX takes to execute various operations internally, including routing decisions, authentication, authorization, and custom logic implemented through plugins.
Upstream Service Interaction Latency: If APISIX communicates with upstream services (typically backend applications or microservices), the time spent in this interaction is included in the overall latency. This involves the time taken for the request to travel from APISIX to the upstream service and the time for the response to return.
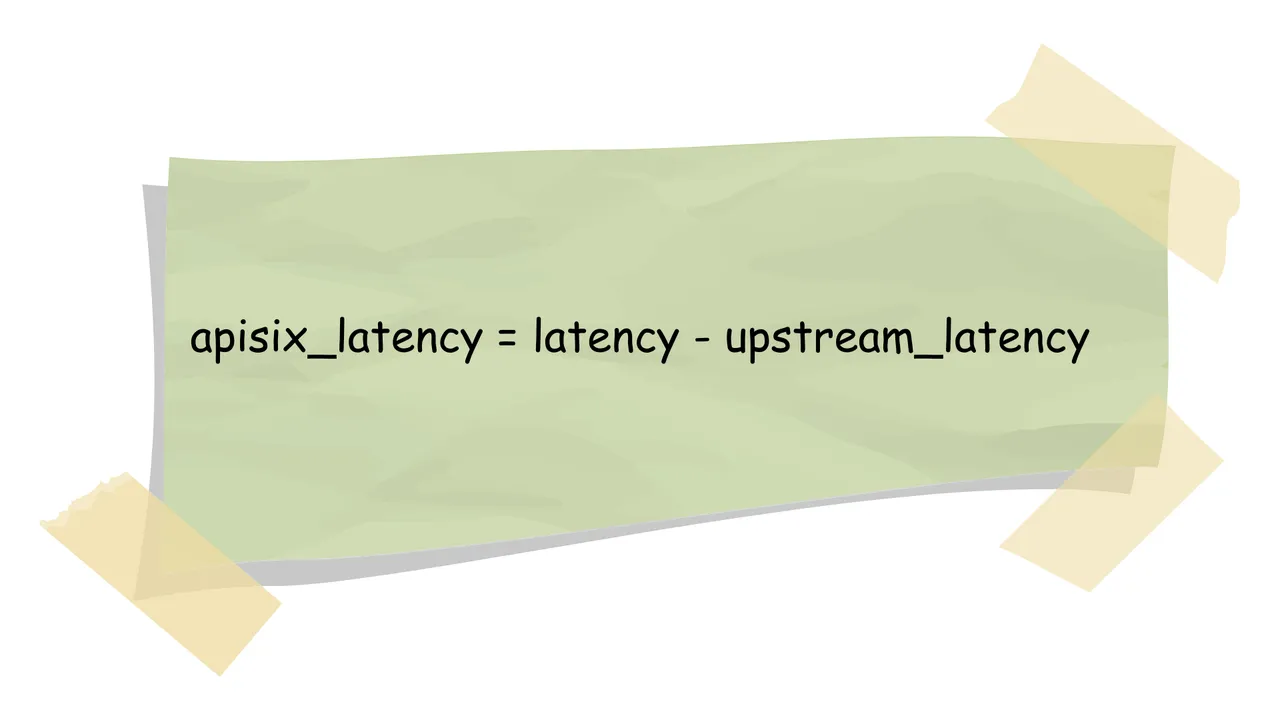
APISIX latency can be calculated using the formula: APISIX Latency = Total Latency - Upstream Interaction Latency. Total Latency represents the time from sending the request to receiving the response, while Upstream Interaction Latency focuses on the communication time between APISIX and the upstream service.
The APISIX latency can be classified into three types:
Downstream Latency: Includes network transmission latency and operations like reading the request body between APISIX and the client. Monitoring and analyzing this latency provide insights into communication performance for optimization.
NGINX Latency: As APISIX uses NGINX for request handling and routing, the internal runtime of NGINX affects the overall latency. Specialized tools can be employed for monitoring.
Lua Plugin Code Execution Latency: Considering APISIX's numerous Lua plugins, each plugin's execution time is a significant factor. Specialized tools are required for analysis.
To resolve latency issues, a systematic analysis can be conducted based on the identified latency components. Solutions include optimizing network architecture, utilizing CDN for client network latency, pinpointing problematic Lua code in APISIX, and examining upstream service interactions for potential issues. Continuous monitoring and analysis enable timely detection and resolution of potential problems, facilitating better optimization of API services to meet end-client requirements.
Understanding and managing APISIX latency is essential for ensuring optimal API performance. Through thorough analysis of each component, continuous monitoring, and strategic optimization, API services can be enhanced to improve availability and responsiveness, meeting the needs of end-users effectively.
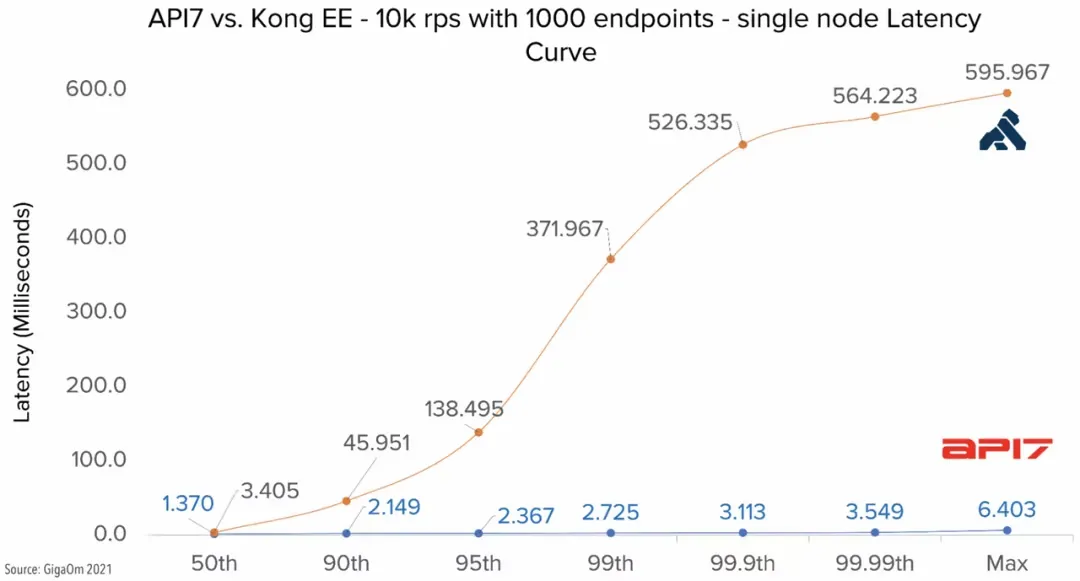
For QPS and latency comparison data between APISIX and other gateway products, refer to "Why Is Apache APISIX the Best API Gateway?".